
Strategy · 4 min read
Calculate Pool Shot Risk With Your Own Practice Percentages
Risk versus reward becomes useful only when both sides are defined. The make percentage alone ignores position after success and the likely leave after a miss; a defensive percentage alone ignores whether the safety produces control or merely returns a difficult shot. This worksheet collects personal rates from one fixed layout, combines them transparently and turns the result into a choice you can revisit as your skills change.
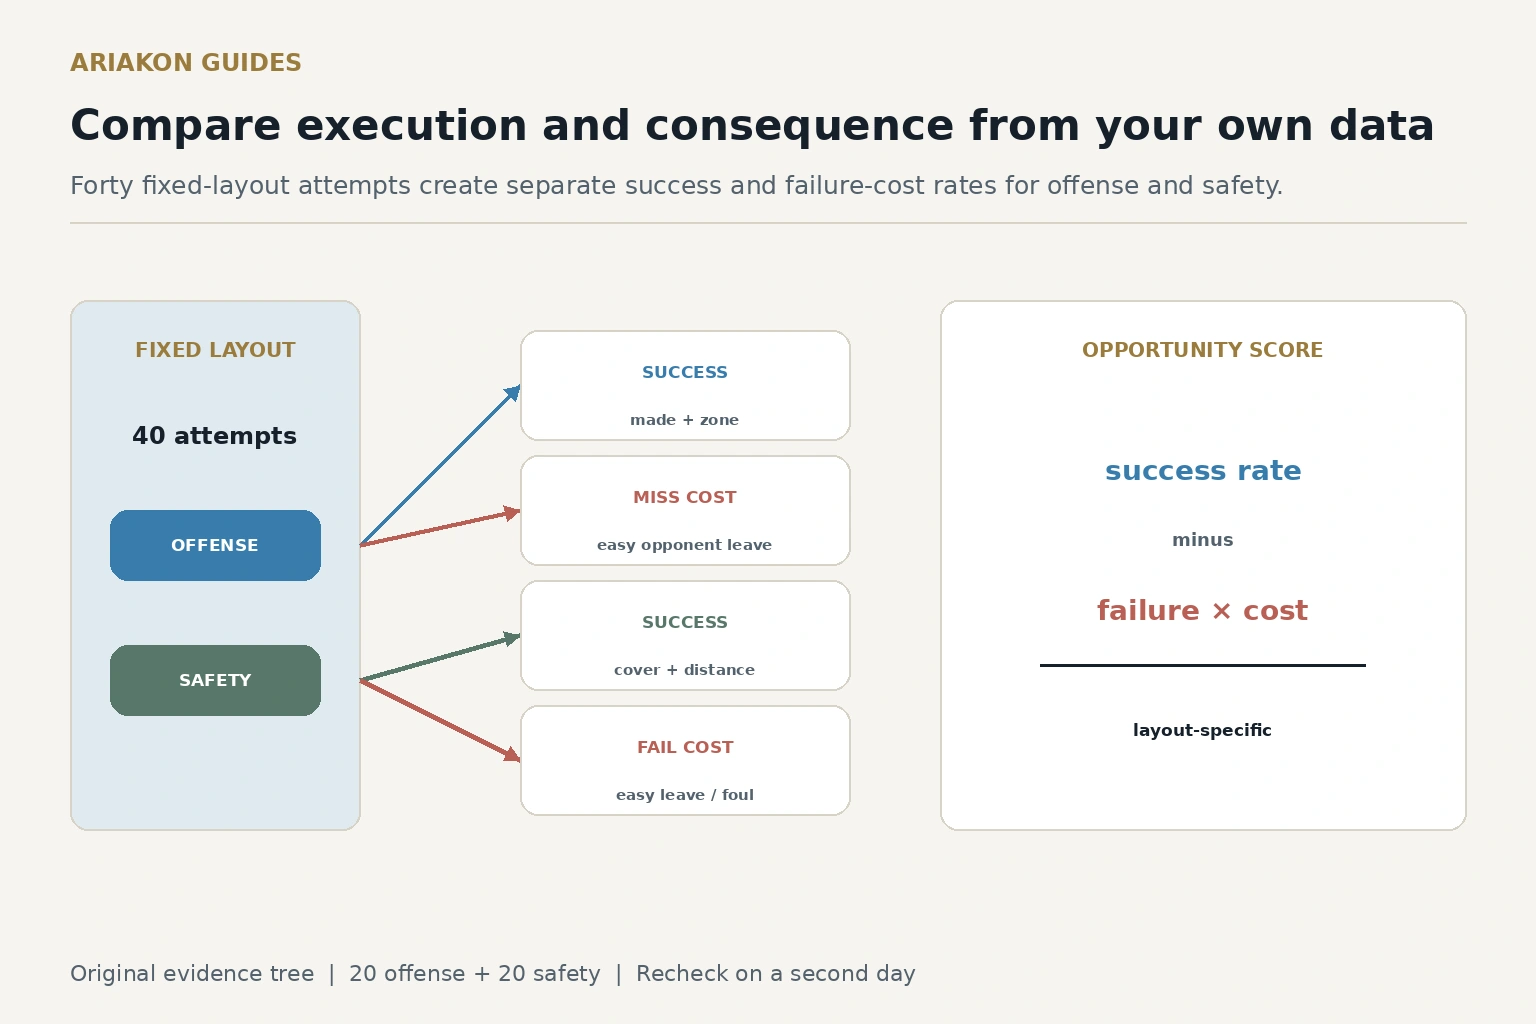
Define two legal choices from one layout
Mark one offensive shot and one defensive shot from the same cue-ball and object-ball positions. Name the intended pocket and cue-ball zone for offense. Name the legal object-ball contact, cue-ball cover and minimum separation for safety. Use the current rules of the game you are practicing.
Do not compare a fully specified shot with a vague alternative. The three-question decision guide asks what you can execute, where the cue ball must finish and what happens on a miss. This worksheet supplies personal percentages for those questions.
Frame the two choices with three questions before collecting percentages.
Collect twenty attempts per choice
| Choice | Attempts | Primary success | Consequence observation |
|---|---|---|---|
| Offense | 20 | Ball made plus called position zone | After any failed called outcome, record easy reply, difficult/no direct reply, foul or unknown |
| Safety | 20 | Legal contact plus called cover and separation | Opponent has kick, difficult edge, full view or ball in hand |
Calculate rates without false precision
| Measure | Formula | Use |
|---|---|---|
| Offense success | Called offensive successes ÷ 20 | Chance of earning the intended next position |
| Offense failure cost | Failed called outcomes leaving an easy opponent shot or foul ÷ all failed called outcomes | Consequence when offense fails |
| Safety success | Called safety successes ÷ 20 | Chance of achieving cover and distance |
| Safety failure cost | Safety failures leaving an easy opponent shot or foul ÷ safety failures | Consequence when defense fails |
Define failure and missing outcomes before dividing
A failed offensive outcome includes a legal pot that misses the called position, as well as a miss or foul. Observe the actual reply from that leave; do not classify only missed pockets. If there are no failures, the conditional failure-cost fraction is undefined and its product is zero for this record; write no observed failures, not zero future risk. Unknown result or reply removes that row from the applicable known denominator. Twenty is the planned allocation, not an excuse to invent observations.
Build a simple opportunity score
Use a planning score rather than a universal win probability. Let s be the known fraction of complete called successes, f=1−s, and c the fraction of those failed called outcomes that leave an easy reply or foul. Opportunity score is 100(s−f c), with success and danger equally weighted by convention. A legal pot missing position belongs to failure as defined above; it cannot disappear from both columns.
The subtraction makes severe failures visible but gives success and danger equal weight by convention. Change the weighting only when a match state clearly changes the value—for example, a hill-hill layout with the game ball exposed. Record the weighting so the result remains auditable.
Work a hypothetical example
| Choice | Success | Failure cost | Opportunity score | Reading |
|---|---|---|---|---|
| Offense | 9 of 20 =45% | 7 of 11 failures; retain exact fraction | 100 × [9/20 − (11/20)(7/11)] =10 | Large downside |
| Safety | 14 of 20 = 70% | 2 of 6 failures; retain exact fraction | 100 × [14/20 − (6/20)(2/6)] =60 | Better practice evidence |
Check whether the sample is stable
Repeat the forty attempts on a second day, alternating five-shot blocks so fatigue and table change affect both choices. If either success rate changes by more than 15 percentage points, label the estimate unstable and collect another session rather than averaging it into a confident claim.
A repeated fixed-layout record can identify a local practice question. Your local percentages have the same boundary: they describe this layout, table and current player—not every shot of the same name.
Transfer the number into a decision clock
| Question | Evidence | Action |
|---|---|---|
| Is the layout inside the tested family? | Similar angle, distance and obstruction | Use the worksheet as a reference |
| Did score or table condition change the downside? | Game ball, scratch route or opponent strength differs | Adjust the consequence weight explicitly |
| Is the evidence unstable? | Sessions differ by more than 15 points | Use the safer miss and collect more data later |
| Is neither option acceptable? | Both scores low | Search for a third legal containment option |
Sources and further reading
References support the specific factual information above. The practical checklists are Ariakon editorial guidance.